The Small Investor’s Advantage – the Impact of Investment Size on Returns to Skill

How do you turn a disadvantage into an advantage?  If you’re a large company with plenty of marketing dollars, the answer is clever advertising that takes advantage of human psychology. Thus, large financial company advertising implies that the company size and longevity equals superior products. 

How do you turn an advantage into a disadvantage?  If you are an individual investor, the answer is – believe in the story the big companies are telling you with their advertising.    

There are many cases where large companies have advantages in serving consumers other than just entertaining advertisements.  On the other hand there are many services and products where smaller more focused businesses are the better choice for consumers.  When it comes to investing, large advertising budgets in no way benefit investors.  It is our natural human nature to try to find short cuts to avoid using our scarce attention to figure things out for ourselves, but when investing for retirement, it’s worth thinking about things a little more carefully. 

As portfolio dollars grow, trading flexibility declines:  it becomes more difficult and time consuming to invest (or divest) a given percentage of the portfolio in any particular security.  The market price you see during the trading day is determined by how many shares people (or computers) want to sell and how many they want to buy – and how anxious they are to trade. A large order to buy shares at a given price can exhaust all the sellers at that price for some amount of time (and the same is true of sell orders). Therefore to complete the purchase, the buyer must either increase the buying price to buy from the next layer of sellers who are waiting for the higher price, or, sit tight and wait for more sellers to show up who are willing to trade at the original price. The larger the order relative to normal market volume for a security, the larger the price move required to fill the order quickly, or the longer it takes to wait for enough new sales orders to arrive. If the investor chooses to wait, there is risk that the market may move further against them and they will pay an even higher price or not complete the order. 

As a result of the market dynamics described above, an investor with a smaller portfolio will often achieve better buying and selling prices when investing or divesting from a security as compared to an investor trading an equivalent percentage of a larger dollar value portfolio. Alternatively, if the large portfolio investor refuses to adjust the price, they will end up trading a smaller percentage of their portfolio than desired.

It’s clear that we have some advantage here but what is this worth? A research paper titled “Small is Beautiful” published in the Journal of Portfolio Management quantified the advantage of smaller dollar traders versus larger dollar traders. They simulated trading by different portfolio sizes using actual market data combined with similar trading strategies for the funds so as to isolate the size effect.  They defined the large portfolio as 20 times the size of the small portfolio.  With this magnitude of size difference the smaller portfolio returns were higher by 2% annually.  In a market environment where annual returns of 7% are not easy to achieve, this is a huge advantage! Clearly larger portfolios have significant trading disadvantages that grow worse as portfolio size increases.   Small is beautiful indeed.

The size of the portfolio also determines the universe of securities that can have meaningful impact on portfolio returns.  Warren Buffet alluded to this issue in his letter to shareholders in 1995:

In the early years, we needed only good ideas, but now we need good big ideas.  Unfortunately, the difficulty of finding these grows in direct proportion to our financial success, a problem that increasingly erodes our strengths.”

This is why Buffet tends to buy entire companies when he finds something he likes.

In order to understand this issue, let’s consider an example.  In an early 2016 Barrons magazine article, Jeff Gundlach who runs DoubleLine Capital, recommended a small capitalization closed-end fund:  Brookfield Total Return Fund.  The total market value of this fund is $310 million – a relatively small issue.  Here’s what Mr. Gundlach said to Barron’s for their Savvy Investment Ideas article:

There is no way I could buy these institutionally without the discounts instantly disappearing, because the volume is so low, relative to the amount I would have to buy to make a difference on DoubleLine’s $85 billion in assets. Closed-ends are a good opportunity for the retail investor.”

Let’s do some arithmetic to see what he means exactly.  Mr. Gundlach indicated that the fund was at least 10% undervalued. Actually, after the articles came out, the Brookfield Total Return Fund returned 17% over the next 24 trading days.  Even if his firm owned the entire fund prior to the article, the total gain in value would have contributed just .06% (= 310MM/83,000MM * 17%) to his firm’s total returns.  This is not a meaningful contribution and, as explained in the earlier section, he could not have bought the whole fund without moving the price.

At a more general level, as a portfolio increases in dollar value, the number of securities available in the market that can be accumulated in a meaningful size decreases.  For this reason smaller capitalization securities are not as widely followed by institutional investors and these issues can more easily become miss-priced.  This provides opportunities to small funds that larger funds cannot take advantage of as a practical matter. 

Being Small is Good – but Not Enough
Although smaller funds have an advantage in investing relative to larger funds, in itself this does not guarantee good returns. After all, the fund may be small because a history of poor returns has driven investors away. Only small funds with manager skill are likely to outperform. Fortunately there is an academic research paper which focuses on identifying skilled fund managers, while also estimating the impact of fund size on these managers’ returns. That research paper, written by Martijn Cremers and Ankur Pareek, is called
“Patient Capital Outperformance: The Investment Skill of High Active Share Managers Who Trade Infrequently”
The authors performed statistical tests to see which fund variables could be used to explain excess fund returns over the fund benchmarks. (Actually they used five-factor alpha which is an academically more rigorous measure of skill). They report statistical regression results which show that Active Share and Duration are strong predictors of excess returns (i.e. alpha). Even after accounting for these skill indicators, returns were inversely related to fund size: out-performance declines as fund size grows larger. For a look at how fund age effects returns, see our post titled: “Are Mutual Funds More Like Red Wine or White Wine?”
Is Index Fund Investing a Free Lunch?

Most of us intuitively understand that you get what you pay for and there is no “free lunch”. Index fund fees are now zero or very close to zero. It sounds too good to be true, so a bit of skepticism is warranted. Low fees are inherently good for investors – but we also have to look a bit closer at the investing process to see what we are giving up to achieve these low fees.
But first let’s acknowledge the low fee advantage. Higher fees at other types of funds necessarily mean they must provide higher investment returns to overcome the disadvantage of their higher fees. But It turns out that index funds also have some built in disadvantages in producing gross investment returns (before fees). One such disadvantage is the adverse stock price impact of changes in the benchmark index. The other disadvantage we’ll discuss here is that index funds are price insensitive: they do not try to buy low and sell high to generate returns.
Because index funds must occasionally do trades according to publicized changes in their index, active traders can anticipate and trade ahead of these required trades to drive up the price for buys and drive down the price for sells. These transactions lower returns to the index fund investor but do not show up as costs of the fund. A study in the Journal of Empirical Finance, called “The index premium and its hidden cost for index funds” quantified the impact. The graph below (from the study) illustrates the impact on stock prices when stocks were added or deleted from the Standard and Poor’s 500 index.

The horizontal axis shows time relative to the date of addition or deletion. The vertical axis is the cumulative return impact of the announcement starting 10 days prior to the effective date of the change. The upper blue line is the average return for additions to the index while the lower blue line is the average return for deletions from the index. The green lines show the “confidence interval” range which is a statistical measure of how accurate the estimated averages are. Looking at the upper blue line, this graph tells us that addition announcements cause stock prices to rise in advance of their inclusion in the index so that index funds pay an extra 8% for a stock compared to the price 10 days before the announcement. Then the stock that was added to the index declines about 1% after the index funds have finished their purchases. The lower blue line shows that stocks being deleted from the index drop by more than 10% in the 10 days prior to the index funds’ sales. After the index fund selling is done, these stocks rebound up about 1-2%.
This study estimated the annual costs to index fund investors at .21% – .28% for the Standard and Poor’s 500 index and .38% – .77% for the Russell 2000 index.
Now let’s look at the impact of investing using a price insensitive method. Index funds are by their nature price-insensitive since their rules for their stock holdings are unrelated to the underlying business fundamentals of the companies they own. For example, most index funds are capitalization weighted. This means the stocks are owned in proportion to how much each company is worth so that the largest companies have the most weight in the index and small companies have the least. In contrast, professional investors seek to buy (more) when a stock is cheap and sell when it is expensive. Here’s a quote on this topic from Warren Buffett, one of the most successful investors of our times:
“Long ago, Ben Graham taught me that ‘Price is what you pay; value is what you get.’ Whether we’re talking about socks or stocks, I like buying quality merchandise when it is marked down.”
If price does not equal value, this implies stocks are mispriced. In the real world this happens regularly: stock prices are much more volatile than changes in business fundamentals. Because index fund portfolio weighting is tied to price, they will have higher weights on stocks that are over-priced and lower weights on stocks that are under-priced. This will produce lower returns when pricing errors subsequently reverse as compared to a weighting scheme that does not weight holdings by price.
To illustrate the impact on a capitalization weighted index of mispricing reversals, we can compare its performance to an equal weighted index. An equal weighted index fund is still price-insensitive investing because it does not consider business value. Regular rebalancing of an equal weighted index does, however, require that stocks positions be sold down as their relative value goes up and vice versa so as to maintain the equal weights. Therefore if stock A suddenly goes up 5% temporarily and stock B goes down 5%, the equal weight index would sell stock A and buy Stock B. Then, if these were temporary pricing errors that reversed themselves, stock A would decline 5% after it was sold and stock B would increase 5% after it was purchased. Thus the equal weighted fund is forced by its weighting scheme to buy low and sell high.
Not all price rises or price declines are pricing errors, but these are common enough to produce a return advantage for the equal weighted fund. A 2011 article in the Financial Analysts Journal, titled “A Survey of Alternative Equity Index Strategies”, compares returns for an equal weighted index for the top 1,000 U.S. stocks to the capitalization weighted Standard and Poor’s 500 index. With annual rebalancing, the equal weighted index out-performed the S&P 500 by 2.31% annualized over the study period of 1964 to 2009. This shows that prices do matter for returns and the mechanical nature of index investing does result in a performance penalty because of their price insensitivity.
Skilled active managers start with a disadvantage of higher costs but if they are price sensitive and truly active they can overcome the passive cost advantage. Unfortunately there are a large number of mutual funds that are not different enough from their benchmark index fund to overcome their cost disadvantage. Thus, the problem for investors is the difficulty of identifying the active managers who can outperform and avoiding the rest. Kazio implements a quantitative method developed by academics to identify these managers.

My Quest to Reconcile Theory to Reality on Wall Street – the story that led to Rising Stars.

When I was in the MBA program at Berkeley they gave us a heavy dose of efficient markets theory. Being a good student I took it in, and when I had saved enough to invest in funds, I put a sizable chunk of money into index funds. I was working in a big bank, but mostly dealing with loans and bonds not stocks. I became quite an expert in the intricacies of evaluating risk and return for fixed income – so I moved to Wall Street to apply my skills. It was exciting for me and it was a chance to figure out something that had nagged at me since my days in graduate school.

If markets are so efficient that the experts who spend their careers studying it can’t beat investing in an index fund, then how come these people on Wall Street and their investment firms are making so much money?

Surprisingly there are TWO answers and they are polar opposites and therefore a bit surprising.
But before we get to that, let me tell you what happened to me. I arrived just in time for several major crises – the Asian currency crisis was first. When Thailand devalued and others followed, the hedge fund investors who had borrowed money to amplify their returns were forced to sell investments to raise cash to pay their lenders. Since it was very hard to sell the securities that were related to the devaluations, they sold other things easier to sell.
Since these investors specialized in emerging markets, this caused a contagion that pushed other markets down that had nothing to do with the problem currencies. It occurred to me at this point that my business school theories had failed to capture what was really going on in the market. The securities that had temporarily dropped in price simply because traders needed to raise cash, bounced back not long later – producing fantastic returns for those investors willing to buy when so many needed to sell.
With this lesson in my head, I was ready for the next crisis. When Russia defaulted on their domestic debt, I was ready. I bought closely related securities that were under pressure from the resulting wave of selling but which I felt confident would rebound to produce good returns. In 1999 I made a 75% return buying bonds.


So answer number one is:

1. The market is not efficient – if you understand the markets and you’re willing to trade opposite of the herd, you can earn higher returns

The academic community had also figured out that markets were not really efficient. A string of research papers had shown systematic mispricing relative to the efficient markets ideal. But that’s not really the whole story when it comes to mutual funds. More than half of them will typically not even match the market index returns. Are they just not smart? Despite apparent mispricing in securities markets, the academic studies up to that time had failed to find any evidence that fund managers could exploit the opportunities available to beat the market index other than by chance.
That really bothered me because I knew it could be done (I was doing it myself). Being an academic at heart, I was dismayed that no one had explained why we had opportunities and we had smart fund managers, but (except for a few exceptions) rarely could funds add value versus the index funds.
Finally a couple of professors named Cremers and Petajisto solved the puzzle. They came up with a statistical methodology that sorted the fund managers into different categories and this allowed them to find a subset that could consistently beat the index funds on average. Their key insight was a measure they called Active Share. With this, they were able to explain what was going on in the fund industry.
When mutual fund companies become large and well established the company owners and managers can earn high profits for themselves by marketing their fund well and avoiding significant risks of under-performing by noticeable amounts. Thus they risk much and gain little by trying to beat the index when they have reached a certain level of assets and tenure.


Thus answer number two is:

2. After a fund has some success and gets large enough, the fund sponsor makes lots of money for themselves (and reduces its risk) by investing to match the index rather than trying to beat it.

I was very excited to finally find an academic study that could explain the market I had come to know working as a quantitative analyst on Wall Street.
With the pieces of the puzzle in place, I am publishing The Rising Stars newsletter so you can figure out which funds are most likely to make higher returns for you rather than the ones that are not really adding value.

Mutual funds evaluation

What you need to know to evaluate mutual funds.

Most people have heard of the Dow Jones Industrial Average or the S&P 500 index. These are just two of the many indices that measure returns for categories of U.S. stocks. The Dow Jones Average is the oldest index, but it is not usually used as a benchmark for measuring fund performance. Unlike the modern indices, the Dow Jones is relatively narrow with just 30 stocks and it is not weighted by market values of its components. The following table summarizes the benchmark indices which almost all funds use as their benchmarks to measure their performance.

The Russell 3000 indices include the largest 3000 exchange listed stocks. This encompasses about 98% of the value of the U.S. equity markets. As such it covers small, mid, and large capitalization stocks.
The terms Value and Growth in the index table refer to investing styles that segment the market according to whether stock prices reflect expectations of rapid growth or not. Stocks with lower prices relative to earnings and growth are categorized as value stocks.
Mutual fund risks and returns are mostly determined by the market capitalization and investment style of the segment in which the fund is choosing stocks – meaning its benchmark index. When choosing an active fund the two main things an investor should be concerned with are the risk of the fund and its return compared to its benchmark index. What we want is positive excess return over the benchmark index return. We will refer to this excess return as alpha.
The most basic measure of risk is the volatility of returns. If we are looking at absolute returns rather than returns relative to an index then we can refer to this as absolute volatility. If we are looking at the volatility of excess returns (meaning alpha which is the fund return after subtracting the index return), this is called tracking error. We can also think of this as alpha volatility.
Overall market risk is measured as the volatility of market index returns. Generally the S&P 500 is taken as representing the overall market. If we take the S&P 500 as the standard index then we can measure everything else relative to this index using a measure called Beta. Thus Beta measures the magnitude of movements of a fund or index relative to the standard index – the S&P 500. Therefore the S&P 500 has a Beta = 1 by definition. An investment with Beta < 1 has less sensitivity to market risks than the S&P 500 whereas a Beta > 1 indicates higher volatility relative to the standard index. The S&P 500 monthly return volatility is about 16% annualized over the last 14 years. All the other indices have higher volatility. The Russell 2000 growth index is highest at 25%. The Beta of Russell 2000 growth index is about 1.24. Risk as measured by volatility and Beta increases as the size of companies (capitalization) gets smaller. Within a size category growth stocks are more volatile than value stocks.

The Karate Kid Lesson for Investing

If you’ve never seen the original Karate Kid movie, it’s well worth your time - both as entertainment and as a life lesson that can inspire you to prepare for one of the biggest battles of life – investing for retirement. Perhaps you can picture yourself as Daniel (i.e the Karate Kid), the new kid in Investment town where you are over-matched by well trained adversaries such as the Karate School bullies who use their superior training to keep you down.
You need a way to even the odds, or even better, get the odds in your favor. Unfortunately, the gap between you and them seems large. But like the Karate Kid, you reach the point where you need to close the gap and get this part of your life handled. Of course we all want a quick and easy route to overcoming our challenge. The Karate Kid (named Daniel in the movie) found a teacher in Mr. Miyagi – a mild mannered handyman who demonstrated that his knowledge of Karate was more than a match for the school bullies tormenting Daniel. Daniel asked for fight training and Mr. Miyagi gave him – chores.
Miyagi had Daniel paint a fence, sand the decks, and then wax the car. Sound like drudgery? It turns out that all that seemingly irrelevant work was preparing Daniel by training his muscles the core moves of Karate. Although Daniel was upset at all the work he had to do, it had in fact prepared him for battle.

You also have chores to prepare yourself for investing. Sure you can just pick a fund quickly but, like the Karate Kid, maybe you’ve found that fighting first without preparation gets you hurt. I’m betting that you’re ready to get this part of your life handled. You’ve had some investments that didn’t get you where you wanted to be and you know there must be a better way.
The Karate Kid made some mistakes. He got hit a few times. But, he decided to persist and put in the effort. He was hurt but he hung tough to apply what he learned and he won his battle and along with it, earned the respect of his foe.
The moral for investing is good results come from the effort to find a good strategy and persistence in applying it.
At Kazio we’ve done most of the hard work for you by pulling together and analyzing the data on mutual funds using a statistically proven methodology. Still you will need to do some work to use these “teachings” to gain an advantage, and you will need to be persistent.
With practice it will be easy and satisfying – it’s all about repeating what works!

Do past returns predict future returns for mutual funds?

Yes, but not in the way you probably expect.
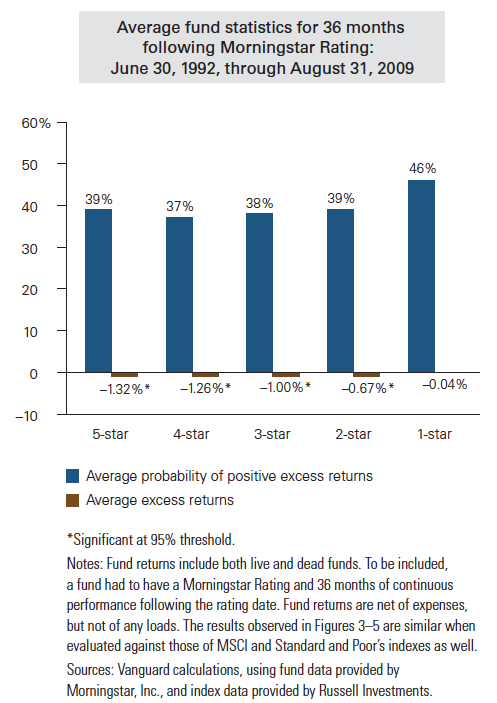
Morningstar has the most well know rating system based on past returns. Within their categories of mutual funds they compare funds’ returns and rate them on a scale of 5 stars with 5 stars as highest.
Vanguard the largest mutual fund company did a study to see how well these star ratings (i.e. past returns) could predict future returns over the 3 years following the rating. They found that the lowest rated funds (1 star) had the highest returns relative to a benchmark index and the highest rated funds (5 stars) had the lowest relative returns. Here’s the chart from Vanguard :

Psychologists say that humans are hard wired to find patterns. But it seems we are looking for the simplest pattern – we expect high returns followed by high returns and low returns followed by low returns. In finance, our instincts lead us astray.
Notice that even though we can use the star rating system to from Morningstar to find funds that do better than average (by picking the lowest rated funds) this category is still only just matching their benchmark (roughly).
We need a better way!

Do Expense Ratios predict future fund returns better than past returns?

According to a study from Morningstar, expense ratios are a better predictor of future performance than their star rating system. But it turns out this is not so helpful. It really only tells us that all funds together in the high cost category do worse than all the funds together in the low cost category. The problem here is that each category, high cost and low cost, has superior funds and inferior funds. Unless bad manager systematically charge more than good managers we would expect each category at the aggregate level to earn roughly the market index return before costs. Therefore, at the category average level, the higher cost category of funds should (by simple arithmetic) end up with lower net returns after subtracting costs.
We can make use of the fact that lower costs are better than higher costs but it’s not enough by itself. What we want to do is find a set of funds expected to produce above market returns and then choose the lower cost funds within this category